GraphClub - graph with stats
GraphClub
The official app & game
Distributed by UptoPlay
SCREENSHOTS
DESCRIPTION
Use UptoPlay to play online the game GraphClub - graph with stats.
Do you want to manage losing weight?
That's the app what you have been looking for.
calorie controlfitness for daily lifewhatever ...
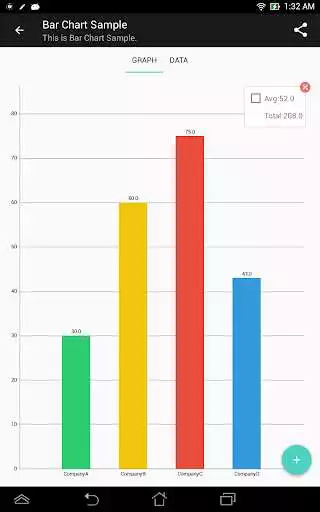
Bar Graph
For display fluctuate data such as production per year or user quantity.
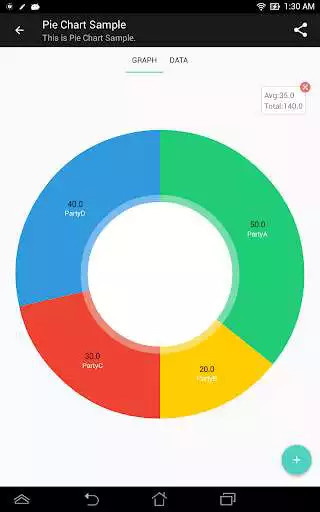
Pie Graph
For display rate and distribution such as expense of month, attitude survey.
Line Graph
For display you weight, temperature which are changeable with time series.
- Share your graph image to SNS, and E-mail it as attachment.
- Manage data with unit describe the data.
- Write memo each relating with data.
- Copy list of data to clipboard.
- Reorder data after you register by item name, register date.
This app is using MPAndroidChart. Thank you for great library.
https://github.com/PhilJay/MPAndroidChart
Enjoy with UptoPlay the online game GraphClub - graph with stats.
ADDITIONAL INFORMATION
Developer: higekick
Genre: Tools
App version: Varies with device
App size: Varies with device
Recent changes: Ver3.5.9 (Dec.22, 2020)
・update internal libraries and frameworks
Comments:
It's very good but is missing a couple things I'd like to suggest like: the side to side scroll work a little better when looking at bar and line graphs it's somewhat hard to scroll on the garph without ending up in the data. The other thing is there is no % option for the pie graph or a chance to change the color of what you put down although a small thing. Lastly would like the option to add more lines to the line chart.
Pretty useful for keeping track of my spending and votes for my suggestions. Thanks for putting in the time and effort to apply my suggestion; it works like a charm!
Thank the gods! This happens to be the only useable app to input data! All the others are utter garbage - and this one is by no means perfect, as I would prefer to be able to add extra lines to see exactly where each bar (on the graph) goes up to (although the numbers above each bar is a nice touch) and plot x-y coordinates to my specifications. Other than that... not bad!
This app is pretty easy to use. I had no trouble punching in my data. The app needs more customisation though. I want to be able to set a minimum chart value along each axis, as well as change the colours of each individual graph section.
This is the closest mini apps to iOS' Numbers I've been looking for. Hope it will develop to much more complex features in the future. Love it."
Page navigation:

